Educator App - User Manual
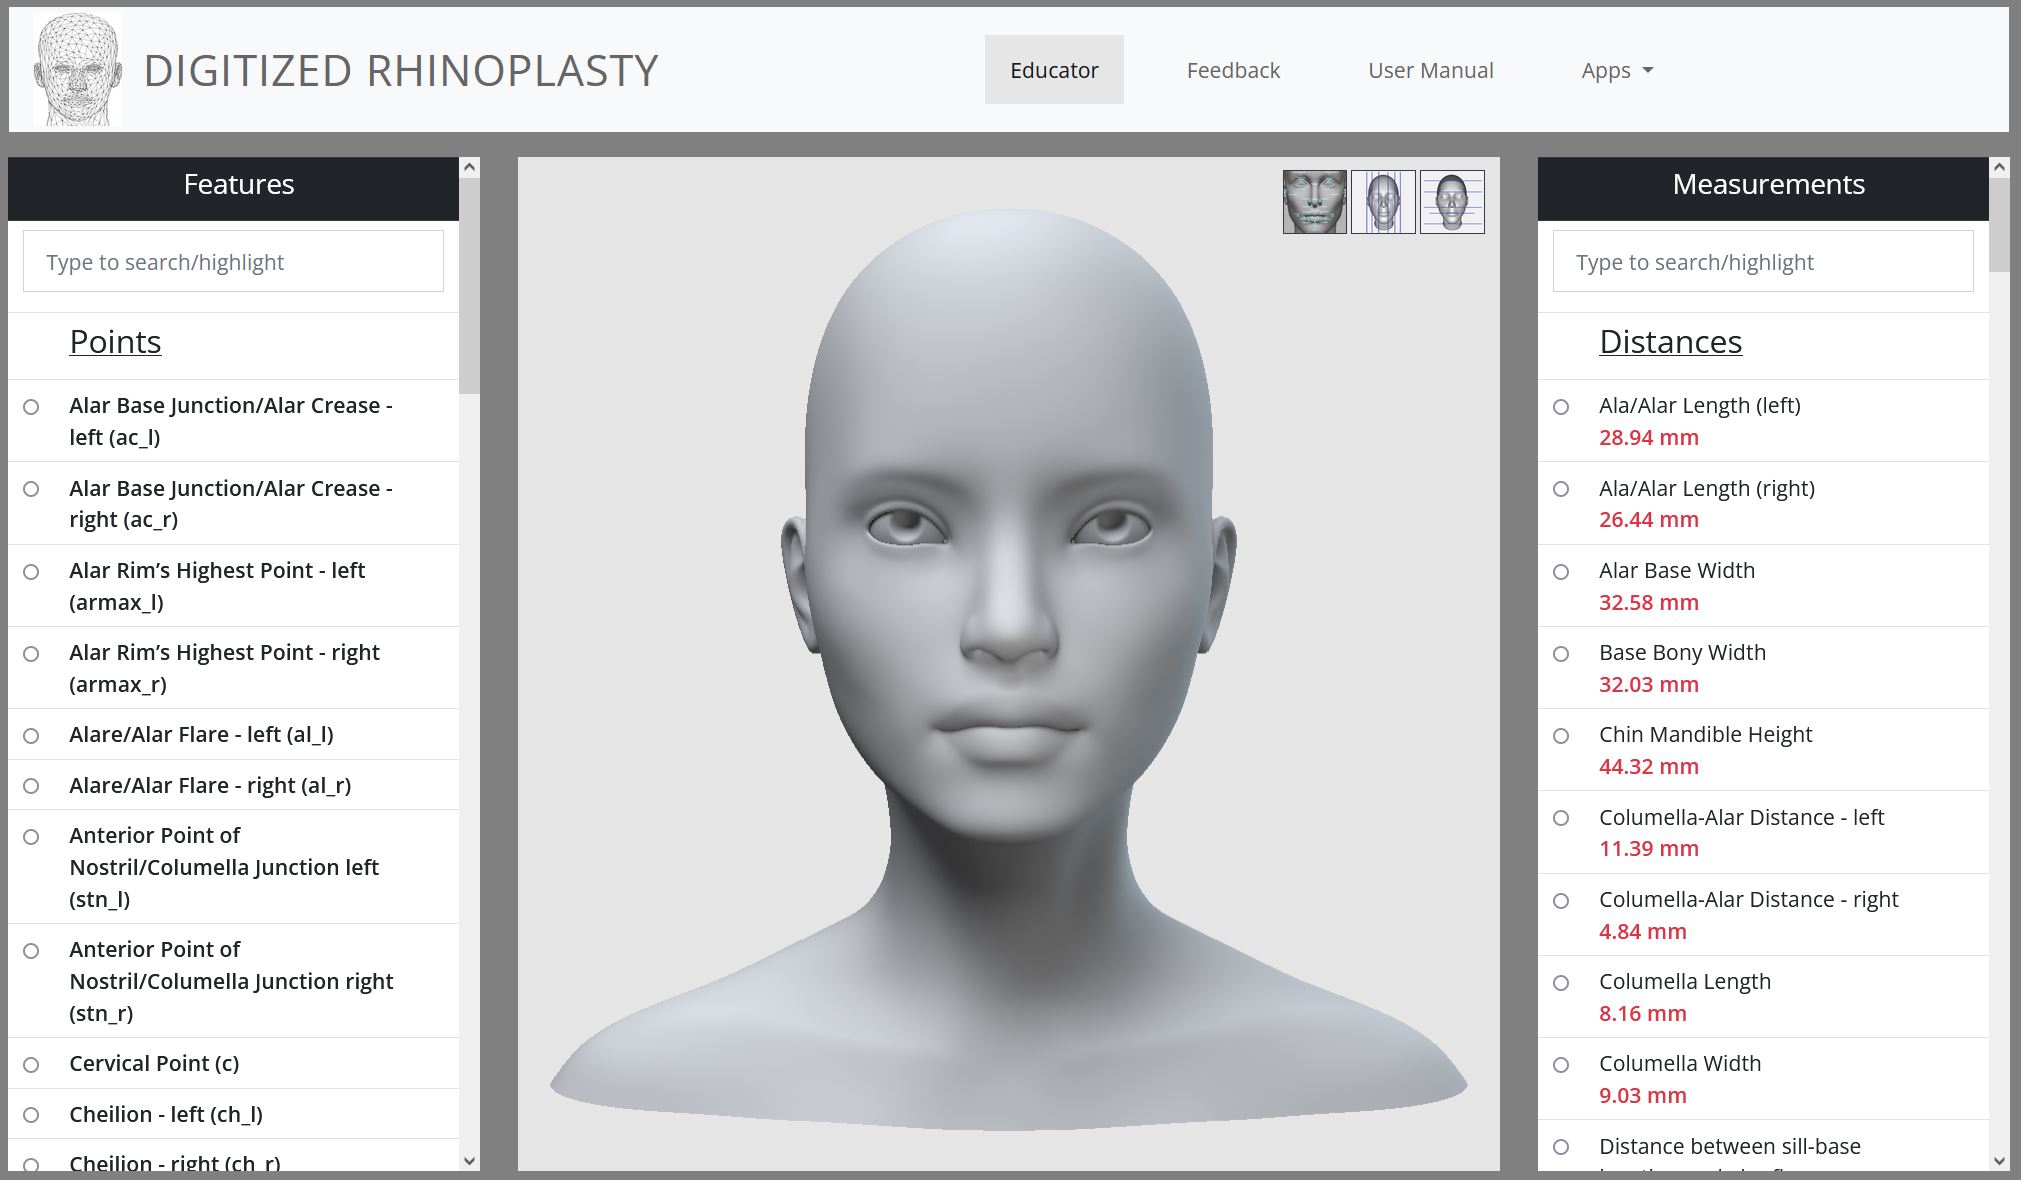
The layout of the 'Educator' page is shown in the Figure below:
- The section on the left lists the feature points (landmarks) on the face.
- The section on the right lists the measurements that were calculated using the coordinates of the feature points.
- The section in the middle (also called 'scene') loads and presents the 3-D model of a face that was already marked.
The functionality of the buttons:
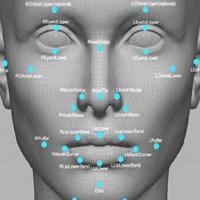 |
Display all feature points (landmarks). All unique feature points will be shown with a label floating above them that has the respective number for a point on the list of feature points. |
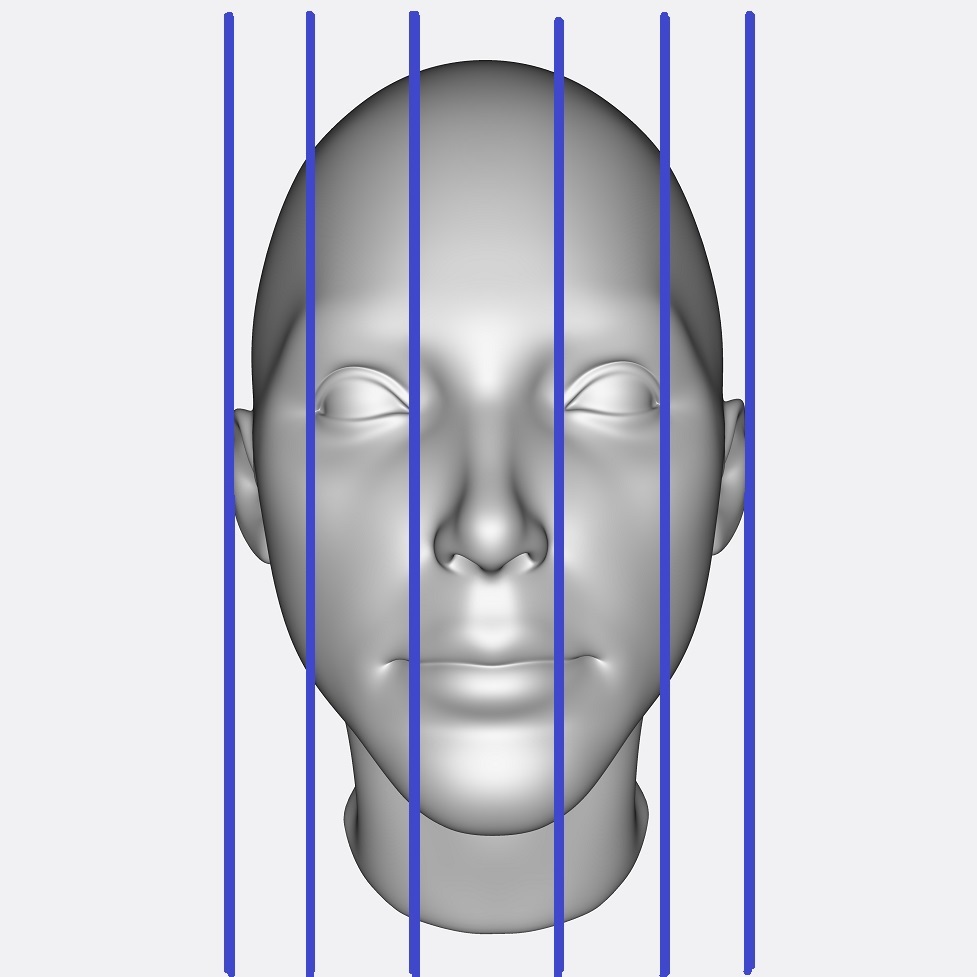 |
Visualizes vertical fifths. If the required points have not been recorded or are not a part of the list, a user would be offered to include them or be reminded to record data for them. |
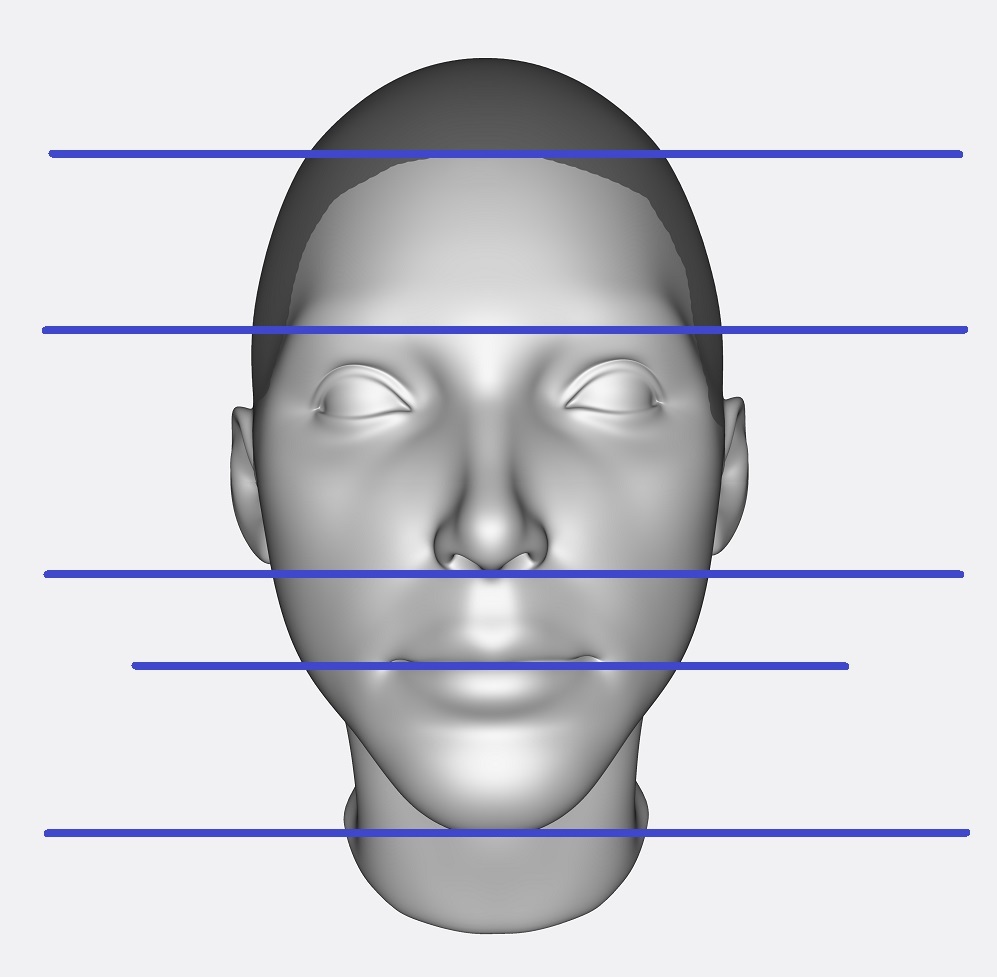 |
Visualize horizontal thirds. If the required points have not been recorded or are not a part of the list, a user would be offered to include them or be reminded to record data for them. |
| * | . |
| * | . |
| * | To PAN (move the 3D model in X and Y coordinates), right click and hold on the 3D model and then move your mouse. |
How to use the app:
1) Interacting with the 3D Model
- Use your mouse to rotate the 3D Model
- Zoom in/out to view in more details
- To PAN (move the 3D model in X and Y coordinates), right click and hold on the 3D model and then move your mouse. (not shown on the vide)
Please watch the video below:
2) Interacting with the features and measurements list
- When a feature point or a measurement is selected, its description is given on the scene.
- When a feature point is selected from the features list, a blue dot appears on the 3D model for the selected feature point.
- When a feature is selected, measurements that uses the selected feature points are listed on the scene and they are highlighted on the measurement list.
- When a measurement is selected from the measurement list, they are plotted on the 3D model if all related feature points are already marked.
- When a measurement is selected, the feature points that are used for the selected measurement are listed on the scene and they are highlighted on the features list.
- If all related feature points are marked for a measurement, the measurement is auto-calculated and its value is written in red on the measurement list.
Please watch the video below:
3) Visualizing
- To visualize all marked features, click on the 'Visualize All Landmarks' button on the top right.
- To visualize vertical fifths, click on the 'Visualize Vertical Fifths' button on the top right.
- To visualize horizontal thirds, click on the 'Visualize Horizontal Thirds' button on the top right.
Please watch the video below:
Troubleshooting:
If you are having issues with the apps, please try using another browser such as Firefox.
If you still have issues, please let us know at contact@digitized-rhinoplasty.com